CUDA binaries turn PTX into ELF you can inspect
A byte-level tour of cubin and fatbin internals, plus a copyable template for inspecting CUDA binaries yourself.
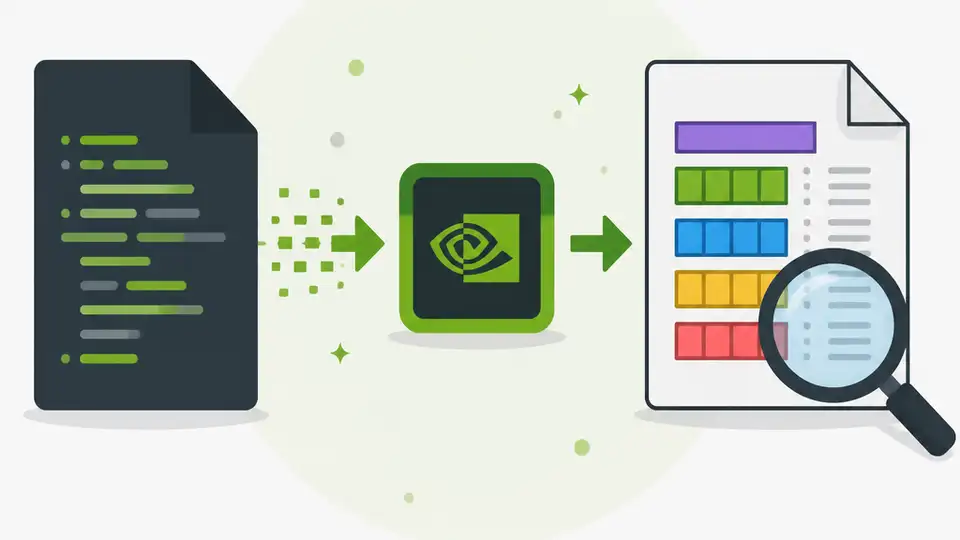
Before, CUDA binaries felt opaque; now I can inspect cubin bytes and fatbin wrappers.
I've been poking at CUDA binaries for a while now, and honestly, the whole thing felt off. I could compile kernels, I could disassemble them, I could even ship wheels that dragged GPU code along for the ride. But when I asked a simple question like “what exactly is inside this file?” I kept getting hand-wavy answers. The docs point at ELF, then wave at “etc.”, and somehow that’s supposed to be enough. It isn’t. If you’ve ever had to debug a build that only fails on one target, or wondered why a cubin changes when you barely touched source, you already know the pain. The machine code is only half the story. The metadata is where the real contract lives, and CUDA hides a ridiculous amount of it in plain sight.
What finally made this click for me was a deep byte-level dissection of cubin and fatbin files in Lorenzo Bradanini and Lorenzo Tettamanti’s write-up on The Software Frontier. They used CUDA 13.3.73 tooling, no GPU required, and walked through the actual container bytes instead of repeating the usual “it’s an ELF file” shrug. I’m going to break down the parts that matter for developers who need to inspect, diff, or reproduce these binaries, not just admire them. I can’t quote their star counts or anything like that because this is a paid article and the source doesn’t provide public metrics, but the technical trail is solid and inspectable.
CUDA is not one compiler, it’s a relay race
Get the latest AI news in your inbox
Weekly picks of model releases, tools, and deep dives — no spam, unsubscribe anytime.
No spam. Unsubscribe at any time.
“nvcc is not a compiler, it’s just a driver that orchestrates other programs.”
That line is the first useful correction. What I used to call “compiling CUDA” is really a pipeline of preprocessors, splitters, front ends, assemblers, and packagers. The article shows a dry run that makes the sequence obvious: host preprocessing, device preprocessing, C++ front-end work, PTX emission, PTX assembly into SASS, then packaging into a fatbin, then host compilation. That matters because every stage leaves artifacts that can be inspected separately.
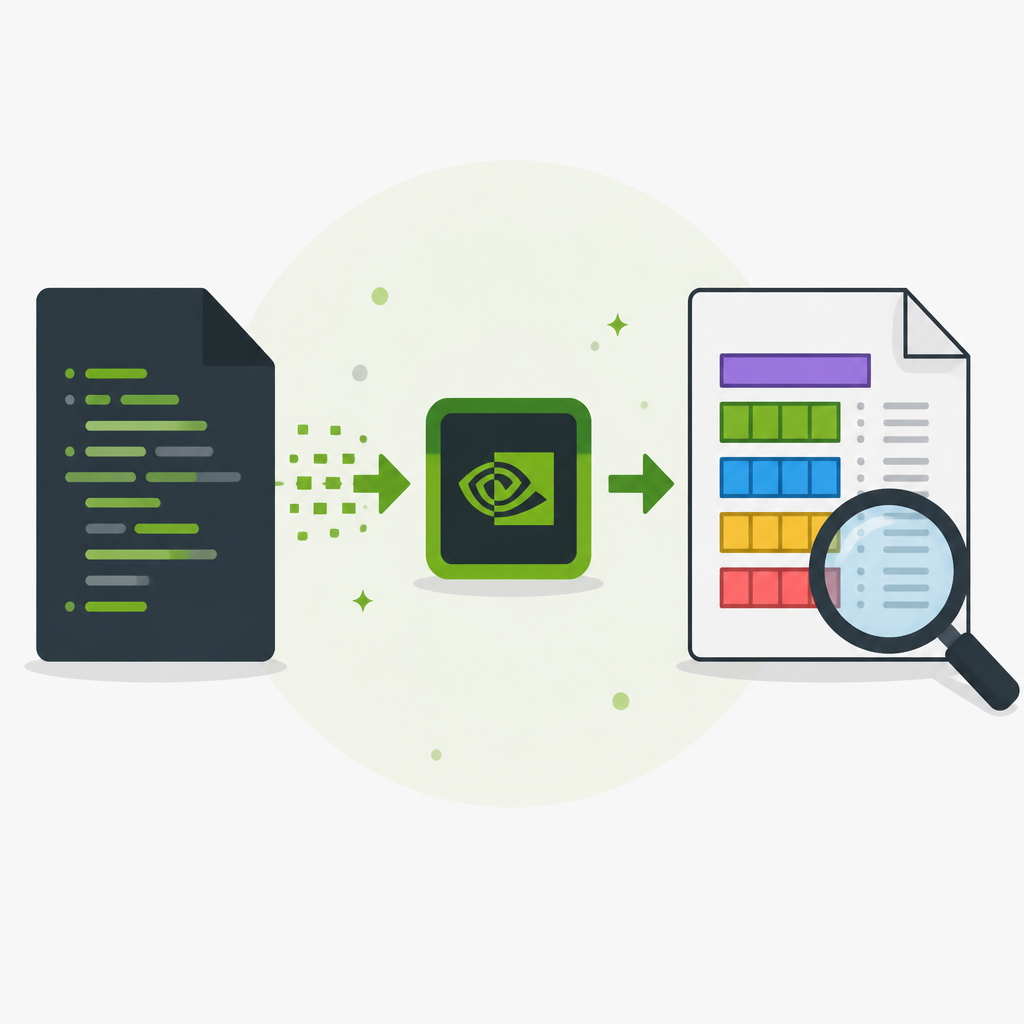
What this actually means is that CUDA binary behavior is distributed across multiple tools, not hidden in one magical compiler pass. If a kernel changes shape, you need to ask which stage changed it. Source-to-source splitting can affect host stubs. PTX generation can affect portability. ptxas can affect register use, stack size, and the final instruction stream. fatbinary can affect how images are bundled. If you only look at the final object file, you’re missing the negotiation that created it.
I’ve run into this when a kernel looked identical in source but produced different output binaries after a tiny macro change. The source didn’t “change” in the way people normally mean it. One of the intermediate files changed, and that was enough. Once you start saving the intermediates with --keep, the mystery usually gets a lot less mystical.
How to apply it:
- Use
nvcc --dryrunfirst when you’re debugging a build. - Use
--keepto preserve the intermediate files. - Inspect the PTX and cubin separately instead of treating them like the same thing.
- Assume the final binary is the result of several contracts, not one compile step.
The cubin is ELF, but with CUDA fingerprints all over it
The article’s next useful move is to show that a standalone cubin is a real ELF64 executable with CUDA-specific fields. That’s not a metaphor. Tools like file and readelf will read it as ELF, but the header carries CUDA-specific values: the machine type is EM_CUDA, the OS ABI byte is set to a CUDA value, and the flags word encodes architecture-related details.
What this actually means is that NVIDIA didn’t invent a new container from scratch. They extended ELF and then stuffed a bunch of CUDA-specific meaning into fields and sections that generic tooling mostly ignores. That’s nice for compatibility, but annoying for humans because the meaningful bits are spread across standard ELF headers, CUDA note sections, and NVIDIA-private section types. It’s a file format that politely pretends to be normal while hiding the important stuff in side channels.
I like this part because it explains why generic tooling gets you only so far. You can see the section table, but the section names and types that matter to CUDA live in NVIDIA’s namespace. The article points out that section types in the 0x70000000 range show up as “unknown” to generic ELF tools. That’s your clue that you’re no longer in standard ELF territory, even though the container still looks ordinary enough to fool casual inspection.
How to apply it:
- Run
fileandreadelf -hon every cubin you care about. - Check the ELF machine type, OS ABI byte, and flags word.
- Don’t assume “ELF” means “portable across ordinary ELF tooling.”
- Expect NVIDIA-specific sections to carry the real CUDA metadata.
Most of the useful data lives in notes, not code
The section table in the article is the part I wish more people would stare at. A trivial kernel produced a file with only 512 bytes of machine code inside a 3,968-byte cubin. The rest is metadata, symbols, notes, relocations, and CUDA-specific sections. That ratio is the point. The code is small; the contract around the code is big.
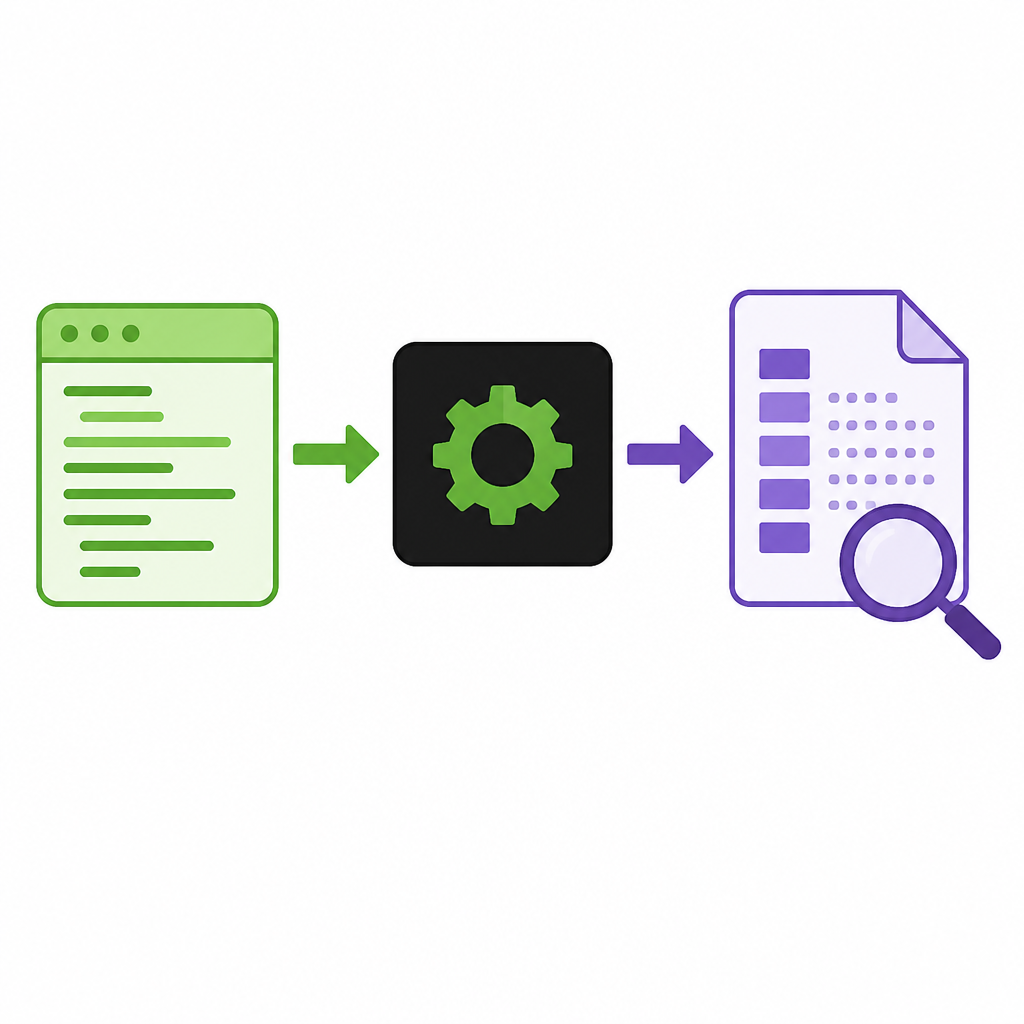
The key sections include .note.nv.tkinfo, .note.nv.cuinfo, .nv.info, .nv.compat, .nv.callgraph, and the kernel’s own .nv.info.<mangled-symbol> section. The article shows that .note.nv.tkinfo records the compiler build and command line used to produce the binary. That’s provenance data baked into the file. If you’ve ever tried to figure out which toolkit built a wheel or a shipped kernel blob, that note is gold.
What this actually means is that the binary is self-describing in ways most developers never check. The compilation flags are not only in your CI logs or build scripts; they can be inside the artifact itself. That’s useful for debugging, but it’s also a reminder that binaries leak more history than people expect. If you care about reproducibility, auditing, or supply-chain tracing, these notes matter a lot.
I’ve seen teams rely on “we know what built this” until six weeks later when nobody remembers which exact CUDA build produced the artifact. That’s the kind of problem that disappears when you inspect the note sections first instead of last.
How to apply it:
- Check
.note.nv.tkinfofor build provenance. - Check
.note.nv.cuinfofor CUDA-specific compilation metadata. - Use
cuobjdump -elfto read the notes without writing your own parser. - Store note-section dumps in CI artifacts for later diffing.
PTX architecture and real target are not the same thing
One of the more annoying discoveries in the article is that the architecture you think you’re targeting is not always where the file stores it. Older tooling exposed PTX architecture in ELF flags. Current CUDA tooling moves that information into note sections, and cuobjdump reports it there as CUDA Virtual SM. The flags word still carries architecture-related data, but not the whole story.
What this actually means is that if you wrote a parser years ago and assumed the flags word was the source of truth for virtual architecture, you may already be wrong. The article shows that compiling the same kernel with different PTX architectures but the same real target can still yield identical flags. The architecture intent is recorded elsewhere now. That’s the sort of quiet format drift that breaks tooling without breaking the compiler.
This is where I get mildly irritated, because the format is still technically “documented” if you count scattered release notes and disassembler output as documentation. But if you’re building tooling, you need to read the actual bytes, not the marketing layer. The file can preserve multiple architectural facts at once: the real target, the virtual target, and feature suffixes like sm_100f that may or may not affect the resulting binary depending on whether the kernel uses family-specific features.
How to apply it:
- Don’t infer everything from
e_flags. - Inspect note sections and disassembler output together.
- Test your parser against multiple CUDA versions.
- Assume architecture metadata can move without warning.
The target list is narrower than people remember
The article also calls out a practical headache: CUDA 13’s supported target list is short. Turing is the floor. Older architectures like Maxwell, Pascal, and Volta are gone from offline compilation support in CUDA 13.0. That’s not a subtle change, and it affects build matrices immediately. If you maintain a package that still targets older GPUs, you have to know which toolkit version can still produce binaries for them.
What this actually means is that CUDA versioning is not just about features, it’s about which hardware your build system can still legally speak to. The article also notes the rename from sm_101 to sm_110 for Jetson AGX Thor, which is exactly the kind of thing that breaks hardcoded scripts. I hate this kind of rename because it’s a silent compatibility trap: your code still “looks” correct while the target name has changed underneath you.
If you’re maintaining a matrix, you need to track three things at once: toolkit version, supported SM list, and any suffix variants like a or f. The article’s point is not that the list is impossible to manage. It’s that you should stop pretending the list is stable unless you’re pinning the toolkit.
How to apply it:
- Pin CUDA toolkit versions in CI.
- Generate target lists from the installed toolkit, not from memory.
- Audit scripts for hardcoded architecture names.
- Keep old toolchains around if you still ship for older GPUs.
Fatbins are the wrapper, not the payload
The article’s discussion of fatbins matters because a lot of developers stop at “the kernel is in a fatbin” and never ask what that means. A fatbin is a packaging layer that can contain one or more images, command-line metadata, and enough structure for the host runtime to pick the right payload. It’s not the kernel itself. It’s the container that helps the runtime decide which kernel image to load.
What this actually means is that a fatbin is closer to a dispatch table than a code blob. If you ship multiple architectures, the fatbin lets the runtime choose among them. If you ship one architecture, it still carries metadata about how it was built and what images are inside. That makes it useful for compatibility, but also means the wrapper can influence what you think you shipped.
I’ve had build systems where the final binary looked simple from the outside, but the fatbin inside carried multiple images and a surprising amount of command-line history. That’s fine when you know to inspect it. It’s annoying when you don’t. If you’re distributing CUDA code, you should be able to answer: which images are present, which one is selected, and what metadata is embedded alongside them?
How to apply it:
- Inspect fatbin contents with
cuobjdumpornvdisasm. - Verify which images are bundled for each target.
- Use fatbins intentionally when shipping multi-architecture builds.
- Don’t confuse the wrapper format with the executable payload.
The practical workflow is inspect, diff, repeat
If I had to reduce the article to one developer habit, it would be this: stop trusting the source and start diffing the artifacts. The authors are explicit that every number and hex dump came from files they produced on their own machine. That’s the right model. When a format is underdocumented, your best source of truth is the bytes you can reproduce.
What this actually means is that CUDA binary work becomes much easier once you treat it like systems archaeology. Generate a cubin. Dump the headers. Dump the sections. Disassemble the text. Compare the note sections across toolkit versions. Compare target variants. Compare a kernel with and without a special feature. The format tells you more through differences than through prose.
I’ve found this approach useful whenever I need to explain why two builds are “the same” in source but not in output. The output is the thing the driver loads. The output is the thing that matters to performance, compatibility, and reproducibility. If you can diff it, you can usually understand it.
How to apply it:
- Keep a small kernel around as a binary-format test case.
- Build it across toolkit versions and targets.
- Save the ELF headers, section tables, and disassembly output.
- Diff those outputs before you blame the compiler.
The template you can copy
# CUDA binary inspection checklist

## Inputs
- CUDA toolkit version:
- Target architecture:
- Source file:
- Build flags:

## Commands
bash
nvcc -arch=${ARCH} -cubin -o kernel.cubin kernel.cu
file kernel.cubin
readelf -h -S kernel.cubin
cuobjdump -elf kernel.cubin
nvdisasm kernel.cubin


## What to record
- ELF machine type
- OS ABI byte
- ABI version
- e_flags value
- CUDA virtual SM from notes
- Toolkit provenance note
- Section table entries
- .text section size
- .nv.info and .nv.compat contents
- Fatbin images, if present

## What to compare
- Same source, different toolkit versions
- Same source, different -arch values
- Same source, with and without feature suffixes
- Same source, with and without debug info

## Questions to answer
- Which stage changed the output?
- Is the change in code or metadata?
- Did the virtual architecture move?
- Did the wrapper change even if the kernel did not?
- Can I reproduce the same bytes on another machine?

## CI artifact suggestion
Save:
- build log
- readelf output
- cuobjdump output
- nvdisasm output
- section-table diff
- toolkit version string
This is the part I’d actually hand to another developer. It’s not glamorous, but it’s the shortest path I know to making CUDA binaries less mysterious. Start with a tiny kernel, dump everything, and keep the outputs under version control. Once you do that, the format stops feeling like folklore and starts acting like a system you can reason about.
My take is simple: CUDA binaries are not opaque because they’re magical. They’re opaque because the important information is spread across ELF headers, NVIDIA notes, section tables, and wrapper formats, and most people only ever inspect the last artifact. Once you look at the whole chain, the bytes tell a coherent story.
Source attribution: the original technical investigation is Lorenzo Bradanini and Lorenzo Tettamanti’s article on The Software Frontier at https://www.thesoftwarefrontier.com/p/how-cuda-binaries-actually-work. Everything above is my breakdown of their findings, with the template at the end adapted for practical reuse.
// Related Articles
- [RSCH]
OctoLong trains LMs on cross-repo code context
- [RSCH]
Argus: a self-evolving runtime for long tasks
- [RSCH]
Reasoning Core builds better procedural reasoning data
- [RSCH]
Anthropic’s security evals are failing on the real internet
- [RSCH]
WorldCup Arena Tests LLM Forecasting Live
- [RSCH]
SocietyBench tests social-event forecasting