SORA Historical Chart Tracks Singapore Home Loan Costs
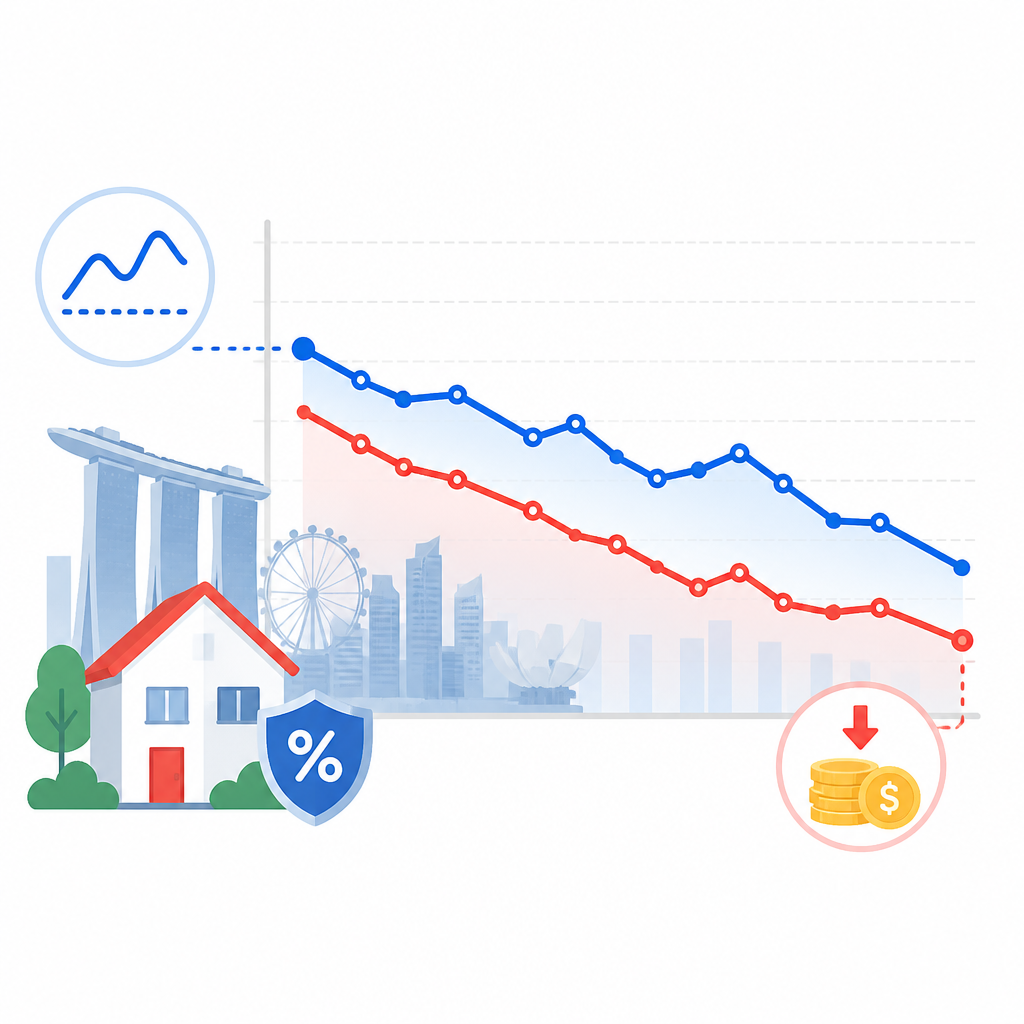
HousingLoanSG’s SORA chart shows how Singapore’s benchmark and compounded SORA rates have moved from 2007 to 2026.

HousingLoanSG’s SORA chart tracks Singapore benchmark rates from 2007 to 2026.
Singapore home loan pricing is still being reshaped by HousingLoanSG’s SIBOR/SORA historical chart, and the latest figures show why borrowers keep checking it. As at 24 June 2026, the page lists 1M SORA at 1.00750, 3M SORA at 1.07270, and 6M SORA at 1.07530.
The chart covers monthly data points from 2007 onward and uses month-end values, which makes it useful for spotting longer rate cycles rather than day-to-day noise. It also marks an important transition: Monetary Authority of Singapore has published SORA since 1 July 2005, while 1M SIBOR and 3M SIBOR were officially decommissioned at the end of 2024.
| Metric | Value | What it means |
|---|---|---|
| Chart history | 2007 to present | Monthly view of Singapore benchmark rates |
| 1M SORA | 1.00750 | Monthly reset reference rate |
| 3M SORA | 1.07270 | Quarterly reset reference rate |
| 6M SORA | 1.07530 | Longer compounded benchmark |
| Last SIBOR point | November 2024 | Final charted SIBOR data before decommissioning |
What the chart actually shows
Get the latest AI news in your inbox
Weekly picks of model releases, tools, and deep dives — no spam, unsubscribe anytime.
No spam. Unsubscribe at any time.
The historical rate chart is a simple but useful reference: it plots SIBOR and SORA over time so you can compare the old bank-quoted benchmark with the transaction-based rate now used in most Singapore floating-rate home loans. The page updates monthly and uses the last working day of each month, so it is built for pattern-spotting, not intraday trading.

That matters because mortgage borrowers do not need a live ticker. They need context. A chart that stretches back to 2007 shows where rates were during easing cycles, where they climbed, and how long those moves persisted. If you are deciding between a fixed package and a SORA-pegged loan, the long view is often more useful than the latest daily print.
- Monthly chart data starts in 2007.
- Values are taken at month end, not daily.
- 1M and 3M SIBOR are gone after end-2024.
- The last SIBOR point on the chart is November 2024.
Why MAS moved Singapore toward SORA
SORA is the volume-weighted average rate of unsecured overnight SGD borrowing transactions in Singapore’s interbank market, measured between 8.00am and 6.15pm. That definition sounds technical, but the practical point is easy to grasp: SORA is based on actual transactions, while SIBOR came from bank quotes. In plain English, SORA is tied more closely to what banks really paid for money.
MAS began publishing SORA on 1 July 2005, and since 6 August 2020 it has also published compounded SORA tenors for 1 month, 3 months, and 6 months. Those compounded rates are the ones most home loan borrowers actually feel, because bank packages often price loans as something like 3M SORA plus a fixed spread.
"SORA is a more reliable and transparent benchmark rate than SIBOR."
That line appears on the HousingLoanSG page, and it captures the policy logic behind the switch. SIBOR was forward-looking and quote-based; SORA is transaction-based. For borrowers, that means less dependence on what banks think rates should be and more on what the market has already done.
1M SORA and 3M SORA behave differently
The two most common mortgage references, 1M SORA and 3M SORA, do the same job in different time frames. The 1-month version compounds the daily SORA rate over roughly 30 days, while the 3-month version looks back about 90 days. That extra time window smooths out short swings, which is why 3M SORA usually moves more slowly.
HousingLoanSG’s own explanation is straightforward: when SORA rises, 1M SORA tends to move up faster than 3M SORA. When SORA falls, 1M SORA usually drops sooner too. So the choice is really about timing and volatility. Monthly resets react faster, quarterly resets feel calmer.
- 1M SORA resets every month.
- 3M SORA resets every three months.
- 3M SORA is less volatile because it averages a longer history.
- Borrowers see higher or lower rates sooner with 1M SORA.
For a household watching cash flow, that difference is not academic. A borrower on 1M SORA may feel rate changes within the next billing cycle. A borrower on 3M SORA waits longer, which can be a relief during spikes and a drag during declines. The trade-off is timing versus predictability, and each loan type makes that trade-off explicit.
What the latest numbers say about loan pricing
The current figures on the page show 1M SORA below both 3M SORA and 6M SORA. That usually tells you the market has been easing in the shorter window, while longer compounded averages still reflect earlier, higher days. It is a useful reminder that compounded rates are backward-looking by design.
For borrowers, the spread on top of SORA matters just as much as the benchmark itself. HousingLoanSG notes that home loans are priced as base rate plus a fixed spread, such as 3M SORA + 0.50%. Banks also tend to offer discounted spreads in the first few years, which can make the initial payment look nicer than the long-term cost profile.
- Example loan pricing can look like 3M SORA + 0.50%.
- Discounted spreads are common in the early years of a loan.
- Lower benchmark rates do not always mean lower monthly payments if the spread is wide.
- Review frequency changes how fast borrowers feel rate moves.
That is why comparing packages needs more than a glance at the benchmark. A lower 1M SORA quote can still lose to a better-spread 3M SORA package. The chart is a starting point, not the whole decision.
What borrowers should do next
If you already have a SORA-linked mortgage, the main question is whether your reset schedule matches your risk tolerance. If you want quicker relief when rates fall, 1M SORA gives you that. If you want fewer surprises, 3M SORA gives you a slower adjustment cycle.
If you are shopping for a new loan, compare the benchmark, the spread, the lock-in period, and the refinance penalties together. A package that looks cheap on paper can become expensive once the spread widens or the promotional period ends. For a practical next step, check the MAS benchmark rates page, then compare it with your bank’s reset schedule and your monthly budget.
The bigger story is simple: SORA is now the benchmark that matters for Singapore home loans, and the historical chart is one of the easiest ways to see how quickly mortgage costs can change. If you are deciding between 1M and 3M SORA today, the real question is how much rate movement your household can absorb before the next reset hits.
// Related Articles
- [IND]
Postgres data movement is the next database battle
- [IND]
Anthropic should stop pricing like a monopoly and ship Claude faster
- [IND]
MiniMax’s lockup expiry is a stress test, not a red flag
- [IND]
AI优先战略为何常常选错方向
- [IND]
GitHub’s AI news lists that save daily triage
- [IND]
Mythos turns a security scare into a cyber audit playbook