AWS DevOps Agent turns incident chaos into triage
I break down AWS DevOps Agent and the exact incident-response workflow it automates, plus a copy-ready ops template.

AWS DevOps Agent turns scattered incident data into a repeatable triage workflow.
I've been around enough incident calls to know when a tool is pretending to help. The dashboard lights up, Slack starts screaming, and everyone does that familiar dance: check logs, check traces, check deploys, ask who changed what, then open three more tabs and hope one of them tells the truth. That’s the part that gets me. Not the outage itself. The wasted motion.
So when I read AWS’s DevOps Agent page at aws.amazon.com/devops-agent/, I immediately looked past the marketing language and straight at the workflow. This is AWS saying it wants an agent that watches your observability tools, code repos, CI/CD, and runbooks, then does the annoying first pass of incident investigation for you. Not just chat. Not just summaries. Actual triage, correlation, and follow-through across tools like Amazon CloudWatch, Dynatrace, Datadog, Grafana, New Relic, Splunk, GitHub, GitLab, Azure DevOps, ServiceNow, PagerDuty, and Slack. That’s the bit worth unpacking.
And honestly, the Zenchef example on the page is the one that made me stop and nod. They had a hackathon going, engineers were busy, an API integration issue hit a downstream partner, and monitoring didn’t hand them a neat answer. Instead of dragging people away from the event, they handed the problem to DevOps Agent. That’s the kind of pressure test I trust more than a polished feature list.
Stop treating incident response like a scavenger hunt
Get the latest AI news in your inbox
Weekly picks of model releases, tools, and deep dives — no spam, unsubscribe anytime.
No spam. Unsubscribe at any time.
AWS DevOps Agent autonomously triages incidents 24/7, providing root cause analysis and actions for resolution.
What this actually means is that AWS is trying to remove the “who owns this clue?” phase from incident response. I’ve done enough ops work to know that the first 20 minutes of an incident are usually spent collecting evidence, not resolving anything. Someone checks the alert. Someone else checks the deploy. Another person opens the runbook, which is usually stale enough to be decorative.
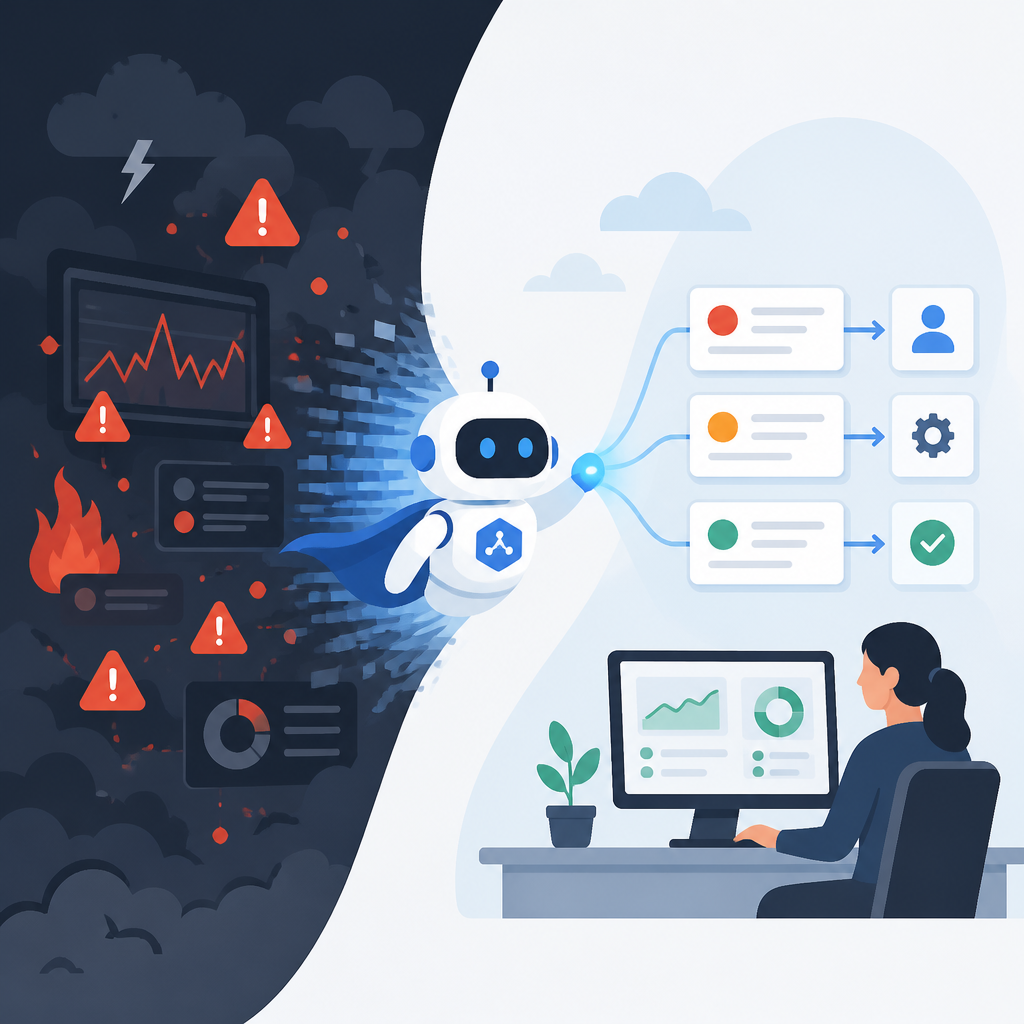
The DevOps Agent pitch is: let the agent do the first sweep. It learns your application relationships, correlates telemetry with code and deployment data, and starts narrowing the blast radius before humans even finish joining the call. That’s a useful shift because most teams don’t need more dashboards. They need fewer blind spots.
In the United Airlines quote, Jason Eckhart describes a hybrid environment with more than 500 AWS accounts, 20,000 Lambda functions, ECS microservices, and 38,000 Dynatrace OneAgents. That’s not a toy setup. That’s the kind of environment where “just look at the logs” is a joke. Their complaint was familiar: multiple tools doing similar things, creating gaps and black boxes during troubleshooting. The agent plus Dynatrace gave them a single place to start.
I’ve seen this failure mode firsthand. In one production incident I worked on, the root cause was sitting in a deployment diff the whole time, but we still spent half an hour arguing about whether the database was the problem because the alert only showed symptom data. If an agent can connect the symptom to the change faster than a human can, that’s not gimmicky. That’s time back.
How to apply it: map your own incident workflow before you touch the tool. Write down what the first responder usually checks, which systems hold the best evidence, and where the handoffs break. If your environment already has observability and deploy metadata spread across tools, the agent’s value is in stitching those together. If your data is thin, the agent will just be a faster way to say “I need more context.”
- List the sources of truth for incidents: traces, logs, deploys, tickets, runbooks.
- Mark the systems that contain change history and ownership metadata.
- Decide which channel the agent should use to publish findings: Slack, ServiceNow, or PagerDuty.
Use the agent to ask better questions, not just get answers
AWS keeps saying the agent is “always-available,” but the more interesting part is that it’s interactive. The page says you can ask questions, get instant contextual answers, and create custom charts and reports that you can save and share. That sounds small until you’ve spent time in a war room where every answer requires a new query in a different console.
The real shift here is from “go find the data” to “hold the context while we investigate.” Conversation history matters. So does the ability to query resource health, investigate incident patterns, and track deployments without bouncing between tools. I’ve used enough observability products to know that the tab-switching tax is real. It slows people down and it also destroys continuity. By the time you come back to a chart, you’ve forgotten why you opened it.
AWS says the agent can create custom charts and reports for operational metrics. That matters because most teams don’t need one more pretty dashboard. They need a reusable artifact that answers a recurring operational question. A daily ops health summary. A 4xx trend report. A deployment-to-error correlation chart. Stuff like that.
The practical takeaway is simple: treat the agent like a junior SRE who remembers the conversation. Ask it to summarize what changed, what degraded, what stayed stable, and what evidence supports each hypothesis. If it can’t answer, that tells you something too. Either your telemetry is incomplete or your environment model is too fuzzy.
How to apply it: define a small set of recurring questions your team asks during incidents. Don’t start with “tell me everything.” Start with questions like these:
- What changed in the last 24 hours that touches this service?
- Which dependency failed first?
- Do we see the same pattern in prior incidents?
- Which deploy correlates with the first spike in errors?
Then make the agent answer those questions in a standard format. If you can get consistent output, you can compare incidents instead of re-litigating them.
Proactive prevention is the real payoff, not the demo
The AWS page leans hard on prevention, and I think that’s the right move. Incident response is the obvious use case, but the more durable value is in the recommendations. AWS says the agent analyzes patterns across historical incidents and produces recommendations in four areas: observability, infrastructure optimization, deployment pipeline enhancement, and application resilience.
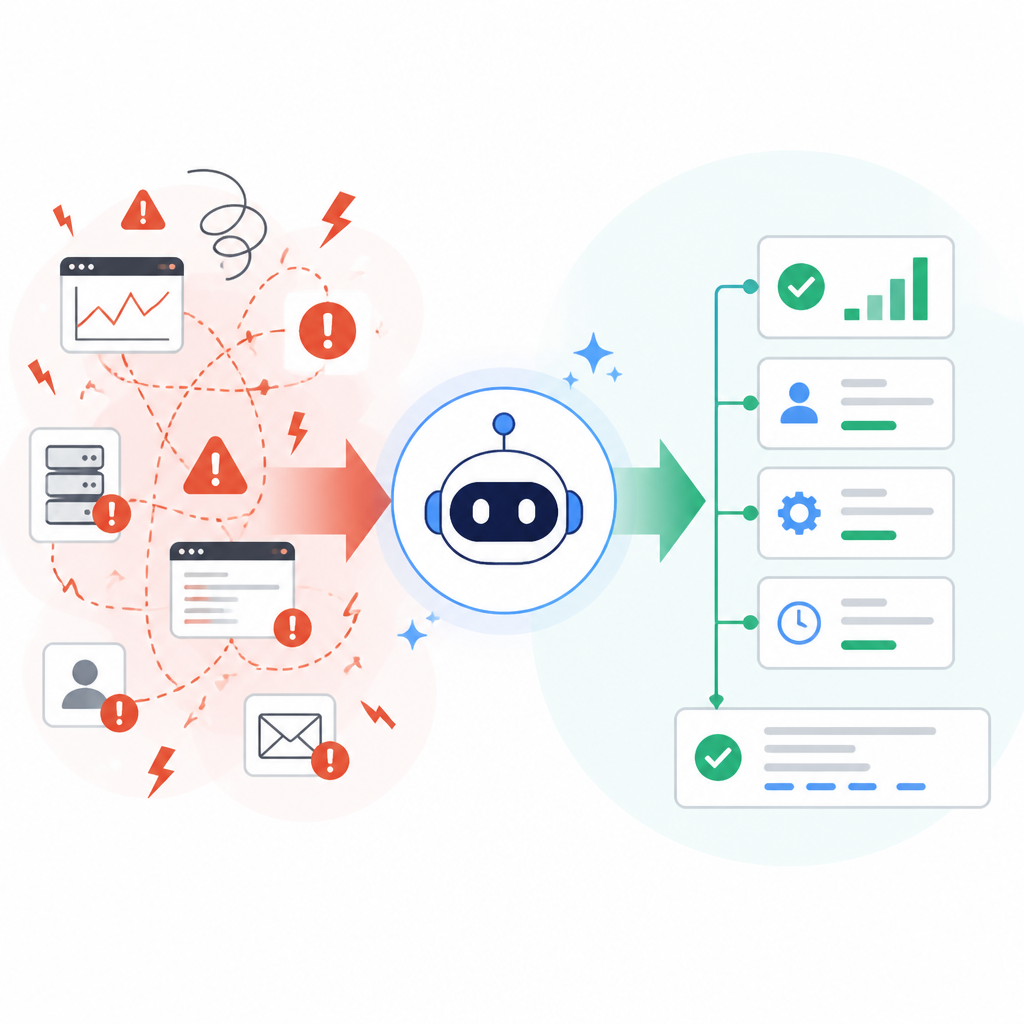
That list is interesting because it mirrors where teams actually bleed time. Missing telemetry. Wasteful infra. Sloppy deploys. Fragile app behavior. Most postmortems produce a bunch of good intentions and then die in a backlog. AWS is trying to short-circuit that by making recommendations “agent-ready,” meaning they can be handed off to your coding agent or a colleague to update code or infrastructure.
I like that framing because it acknowledges reality. The recommendation is not the fix. The fix still has to land in code, config, or pipeline changes. But if the agent can package the next step cleanly, you’re less likely to lose the thread between “we learned something” and “we actually changed something.”
Western Governors University’s quote is the strongest evidence on the page for this angle. They say DevOps Agent helped cut a production investigation from an estimated two hours to 28 minutes, a 77% improvement in MTTR. More importantly, it surfaced a Lambda configuration issue and found operational knowledge that had been buried in internal docs. That’s the kind of thing I care about: not just speed, but discovery.
Here’s the practical move. Don’t wait for a crisis to see whether the agent can help you prevent one. Feed it recurring incident patterns and ask for the top three fixes that would reduce repeat tickets. Then sort those fixes into buckets: telemetry gaps, pipeline issues, infrastructure constraints, and app resilience. If the same category keeps showing up, that’s your backlog whether you like it or not.
How to apply it:
- Review the last 10 incidents and cluster them by cause.
- Ask the agent which signals were missing or misleading.
- Turn each recommendation into a ticket with an owner and a deadline.
Integrations are the whole product, not a side feature
If there’s one thing AWS gets right here, it’s that this agent is only useful if it can see the rest of your stack. The page is explicit: built-in integrations with CloudWatch, Dynatrace, Datadog, Grafana, New Relic, Splunk, Azure DevOps, GitHub, GitLab, ServiceNow, PagerDuty, and Slack. It also says you can connect to private or remote MCP servers, which is AWS’s way of saying you can extend it into custom tools and proprietary systems.
That matters because most incident investigations are cross-system by nature. The alert is in one place. The logs are in another. The deploy happened somewhere else. Ownership lives in a ticketing system. The runbook is in a repo nobody wants to maintain. If the agent can’t traverse those boundaries, it’s just another chat surface with a fancy badge.
T-Mobile’s quote is useful here. They were a design partner, and they specifically call out Splunk integration across multicloud and on-prem environments. That tells me AWS is aiming at the messy middle, not just the clean AWS-only shop. Good. That’s where the real pain is.
I’ve worked in environments where observability was technically present but socially fragmented. One team used one tool, another used another, and nobody had a complete picture. The result was predictable: every incident became a debate about whose data was “real.” An agent only helps if it can correlate across those silos without making you export CSVs like it’s 2014.
How to apply it: audit your incident toolchain before rollout. Identify the systems that should be queryable, the systems that should receive updates, and the systems that are only there for reference. Then decide what “good integration” means for each one. Read-only access is not enough if the agent needs to push findings into Slack or open a ServiceNow record.
Here’s the checklist I’d use before trusting it in production:
- Can it read logs, metrics, traces, deploy history, and ownership metadata?
- Can it post findings where responders already work?
- Can it connect to custom systems through MCP if the built-ins fall short?
- Can it preserve context across a full investigation?
The hackathon story is the most honest proof on the page
The Zenchef example is better than the usual enterprise fluff because it describes a real operational constraint: nobody had bandwidth. Engineers were busy with a hackathon, monitoring didn’t point anywhere obvious, and the issue was affecting a downstream partner. That’s the kind of moment where a tool either earns its keep or becomes another thing everyone resents.
According to the page, the agent ruled out authentication, shifted focus to ECS deployments, and traced the problem to a code regression involving an unrecognized enum value in the database. The full investigation took 20 to 30 minutes, versus the one to two hours they expected manually. That’s not magic. That’s structured elimination.
I trust this example because it shows the agent doing boring work in a stressful window. No heroics. No “look how smart the AI is.” Just systematic narrowing of possibilities and a final explanation that could be handed to the engineer who owns the fix.
That’s also why I think this product will live or die on trust. If the agent can explain why it ruled things out, engineers will use it. If it just spits out a conclusion with no chain of reasoning, people will ignore it the first time it’s wrong. In ops, confidence is earned by being right in ugly situations, not by sounding polished.
How to apply it: test the agent on a real but low-risk incident first. Don’t start with your worst outage. Start with a known issue that already has a documented root cause. See whether the agent finds the same path, how it explains its reasoning, and whether its output is useful to the person who would actually fix the bug.
Then ask your team one blunt question: did this save time, or did it just move the work around? If the answer is “saved time,” keep going. If the answer is “moved the work,” tighten the integrations and the workflow before you roll it out wider.
The template you can copy
# AWS DevOps Agent rollout template

## 1) Incident sources
- Observability: CloudWatch, Datadog, Dynatrace, Grafana, New Relic, Splunk
- Code and deploy history: GitHub, GitLab, Azure DevOps
- Coordination: Slack, ServiceNow, PagerDuty
- Custom systems: MCP-connected internal tools

## 2) Questions the agent must answer
1. What changed in the last 24 hours?
2. What dependency failed first?
3. What evidence supports the current root cause hypothesis?
4. What similar incidents happened before?
5. What fix should we apply next?

## 3) Standard incident output format
- Incident summary
- Affected services
- Timeline of events
- Top 3 hypotheses
- Evidence for each hypothesis
- Root cause
- Immediate mitigation
- Recommended follow-up work
- Owner and next action

## 4) Prevention workflow
- Review the last 10 incidents weekly
- Group incidents by cause: observability, infra, pipeline, app resilience
- Convert each repeat pattern into a ticket
- Require an owner, due date, and expected signal improvement

## 5) Agent handoff rules
- If confidence is low, ask for more telemetry instead of guessing
- If a deploy is implicated, include commit and release references
- If a ticket is needed, open it with the investigation context attached
- If a fix is suggested, make it actionable for a human or coding agent

## 6) Output to share with the team
- Slack summary for responders
- ServiceNow incident notes
- PagerDuty update for on-call
- Follow-up report with charts and trend lines

## 7) Evaluation checklist
- Did the agent reduce time to first useful hypothesis?
- Did it correlate logs, metrics, traces, and deploys?
- Did it explain why it ruled out other causes?
- Did it produce a fix the team could actually use?
- Did it reduce repeat investigations over time?
The template above is my own synthesis of the AWS DevOps Agent page and the examples AWS published. The original source is https://aws.amazon.com/devops-agent/; the structure, wording, and rollout checklist here are derivative, while the implementation framing and copy-ready workflow are mine.
If I were introducing this internally, I’d keep the pitch simple: use the agent to compress the ugly first half of incident response, then use its recommendations to stop seeing the same mess twice. That’s the part that matters.
// Related Articles
- [AGENT]
Kimi K3 Benchmark Evaluation Guide for Coding Agents
- [AGENT]
Meta’s first paid model proves AI coding is now a price war
- [AGENT]
Claude Code turns chat into terminal work
- [AGENT]
Decentralized AI compliance should be built into agent rails, not bol…
- [AGENT]
Open-Source AI Agent Frameworks Compared
- [AGENT]
Codex Micro turns a macropad into an AI control deck